01 / 08EVENT
A new document arrives
Field study notes
- Source document received
- Original retained
- Ready to review
Received
A research document starts the work. The original stays available throughout.
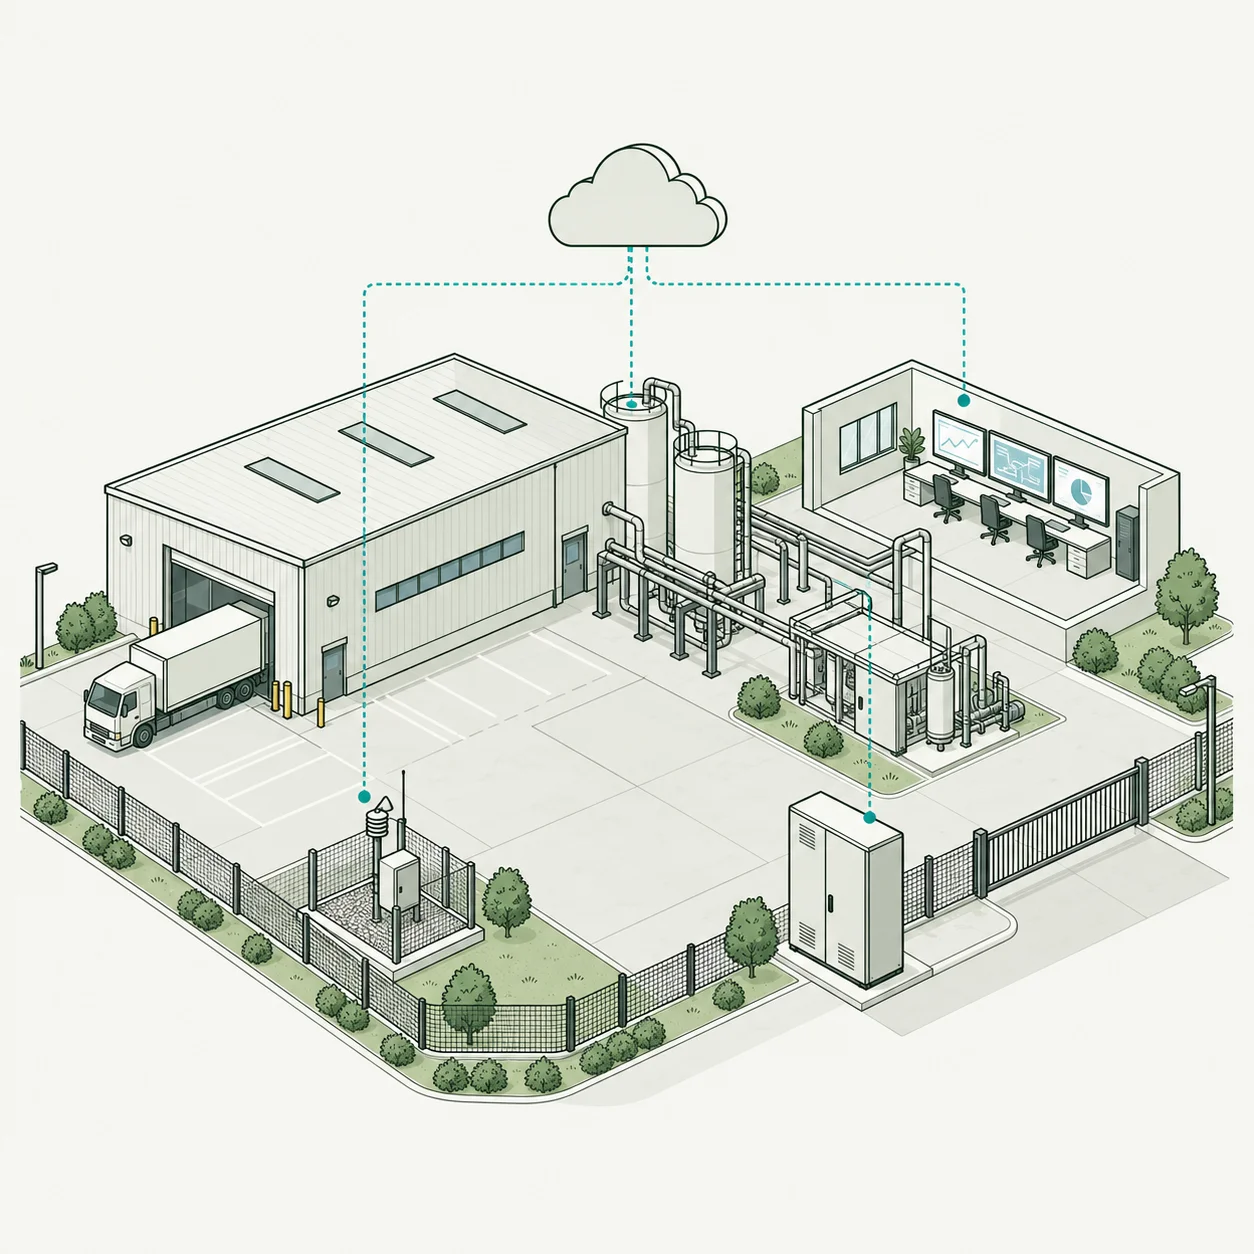
Stacx24 combines edge processing, telemetry, cloud software and operational intelligence to connect what happens in the physical world with what needs to happen next.
Not an industry vertical: a kind of operation. Plants, sites, farms, buildings, fleets, labs. Wherever something physical has to be seen and acted on.
Architecture sequence: PHYSICAL ENVIRONMENT, then SENSORS / CAMERAS, then EDGE DEVICE, then LOCAL PROCESSING, then TELEMETRY, then CLOUD, then INTELLIGENCE, then OPERATIONAL DECISION. Stages marked Human pause the flow until a person decides. Status labels update as the event moves.
PRIMARY ARCHITECTURE · ILLUSTRATIVE SCENARIO · COLD STOREILLUSTRATIVE · COLD STOREThey present differently on every site, but they are the same eight gaps between the physical world and the software that is supposed to represent it. Each maps to a stage of the architecture above, which is where it gets engineered.
HOW IT SHOWS UP: The dashboard says one thing, the person on site sees another.
WHAT THE SYSTEM DOES: One state model, joined to asset records, updated from the edge.
Stage: TELEMETRY · CLOUD
HOW IT SHOWS UP: Terabytes of readings nobody looks at; the one that mattered is buried.
WHAT THE SYSTEM DOES: Filter and correlate at the edge. Send events and summaries, not streams.
Stage: LOCAL PROCESSING
HOW IT SHOWS UP: By the time the alert reaches someone, the damage is done.
WHAT THE SYSTEM DOES: Local rules act in milliseconds. The alert reaches the person on site first.
Stage: EDGE DEVICE
HOW IT SHOWS UP: Remote sites, metal buildings, shared networks. The link drops daily.
WHAT THE SYSTEM DOES: Local buffering, ordered replay, and logic that does not need the cloud.
Stage: LOCAL PROCESSING
HOW IT SHOWS UP: Sensors on one system, work orders on another, nothing in between.
WHAT THE SYSTEM DOES: Telemetry joined to the operational applications that act on it.
Stage: CLOUD
HOW IT SHOWS UP: Someone walks the site with a clipboard, or watches a screen all shift.
WHAT THE SYSTEM DOES: Continuous observation with classified alerts and an owner for each.
Stage: TELEMETRY
HOW IT SHOWS UP: Everything alarms, so nothing does. Alerts have no context or owner.
WHAT THE SYSTEM DOES: Alerts carry context, risk and a proposed action, and go to a named person.
Stage: INTELLIGENCE
HOW IT SHOWS UP: Nobody can say, right now, what is connected, healthy and open.
WHAT THE SYSTEM DOES: Device health, readings, alerts and owners in one observable view.
Stage: CLOUD · DECISION
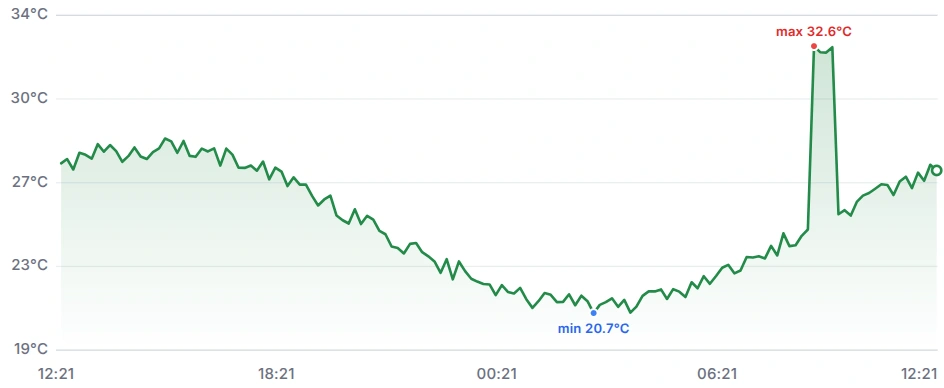
Inside VFarm: sensor trends, device activity, automation and alert delivery in one view. Explore a captured analytics dashboard from the application.
rack2_dht · captured reading
We engineer the right combination.
A research document starts the work. The original stays available throughout.
Existing records, source details and the approved label list give the document context.
Software checks for duplicates and missing information before any AI suggestion.
AI proposes a label from the approved list. It cannot publish the label itself.
The researcher reads the supporting passage and approves or corrects the suggestion.
Only the approved label enters the record, alongside its source.
The system records the suggestion, the review and the saved result so the team can inspect them.
The team reviews corrections and agrees changes to the guidance before the next document.
A research document starts the work. The original stays available throughout.
Existing records, source details and the approved label list give the document context.
Software checks for duplicates and missing information before any AI suggestion.
AI proposes a label from the approved list. It cannot publish the label itself.
The researcher reads the supporting passage and approves or corrects the suggestion.
Only the approved label enters the record, alongside its source.
The system records the suggestion, the review and the saved result so the team can inspect them.
The team reviews corrections and agrees changes to the guidance before the next document.
An incoming request starts a handoff between the tools your team already uses.
The system brings together the request, existing records and its responsible owner.
Defined rules check the request and pass its details between connected applications.
This example needs no AI decision. Defined rules identify an exception and send it to its owner.
A named person supplies the missing detail and confirms that the work can continue.
The confirmed information reaches the next application and the work continues.
The system records completion and exceptions so the team can see what happened.
The team reviews repeated exceptions and approves rule changes for future requests.
An incoming request starts a handoff between the tools your team already uses.
The system brings together the request, existing records and its responsible owner.
Defined rules check the request and pass its details between connected applications.
This example needs no AI decision. Defined rules identify an exception and send it to its owner.
A named person supplies the missing detail and confirms that the work can continue.
The confirmed information reaches the next application and the work continues.
The system records completion and exceptions so the team can see what happened.
The team reviews repeated exceptions and approves rule changes for future requests.
A new field reading starts the cycle, connecting conditions on the ground to the system.
Field history and recent conditions help the team interpret the new reading.
Local edge checks validate readings before relevant information reaches the monitoring application.
The system uses the checked information to propose a response within its defined scope.
The agronomist checks the proposal and approves or adjusts it before it reaches the operator.
The approved proposal reaches the operator with the instructions they need.
New readings and operator reports help the team understand what happened next.
The agronomist reviews the observations and agrees guidance for the next cycle.
A new field reading starts the cycle, connecting conditions on the ground to the system.
Field history and recent conditions help the team interpret the new reading.
Local edge checks validate readings before relevant information reaches the monitoring application.
The system uses the checked information to propose a response within its defined scope.
The agronomist checks the proposal and approves or adjusts it before it reaches the operator.
The approved proposal reaches the operator with the instructions they need.
New readings and operator reports help the team understand what happened next.
The agronomist reviews the observations and agrees guidance for the next cycle.
Something happens in the operation.
Records, history and state are attached.
Rules, software and integrations do the deterministic work.
One bounded AI component, where judgement can be modelled.
A named person decides where it matters.
Something changes in the world.
Telemetry and monitoring record what happened.
The loop feeds back into the next event.
Field sensors and edge inference feeding irrigation and crop-condition decisions, buffered through intermittent connectivity, with an agronomist approving changes before they reach the field.
We use three necessary cookies and, only with your consent, one analytics cookie. No advertising, no tracking. Cookie policy.